Documentation and Help [under construction]
Welcome to The TerraMagnetoScope Documentation and Help Page.
The information below is designed to help guide the effective use of the TerraMagnetoScope and its underlying data sources (This page is constantly under construction).
GRSSAL (Global Realtime Scientific Sensor Aggregation Limn)
The GRSSAL (pronounced "Grissal") is an ongoing attempt to aggregate and display as many Scientific Sensor vectors as possible to providing amateur scientists with the analytic tools necessary to support real-time analysis and facilitate research.
Why GRSSAL? We hope to foster
the development of scientific comprehension by employing a
real-time, data aggregation and display mechanism to highlight the
convergence of differing but associated data sets to gather a better
understanding of our environment. Currently, users can overlay
combinations of:
[Magnetic Field Flux Measurements], [Solar Wind Speed], [Solar Wind
proton density], and [Seismic data] (More Data Feeds Soon!).
Currently the following scientific sensor vectors are available for real-time depiction and analysis (Many More to Come!):
1. World Wide Magnetic Sensor Flux Readings - Courtesy Geomagnetic Observatory Network (GON)
2. Solar Wind Speed - Courtesy Advanced Composition Explorer (ACE)
3. Solar Wind Proton Density - Courtesy Advanced Composition Explorer (ACE)
4. Global Seismic Activity - Courtesy USGS
The image below illustrates how to select your items to display on the limn (Note On Future Versions You will be able to Specify the Date Range):
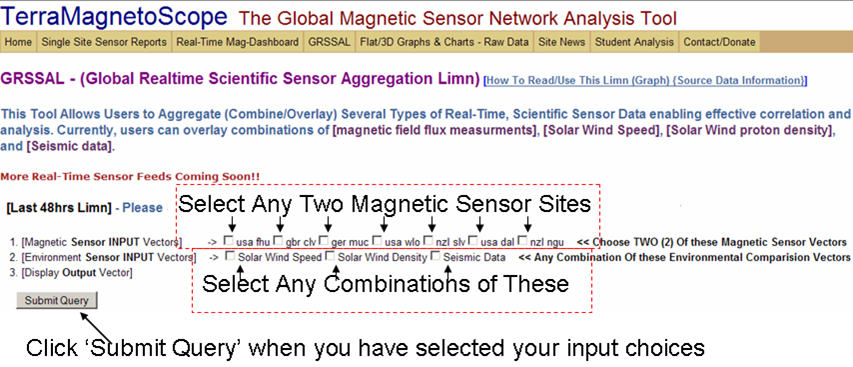
You may select any two magnetic flux sensor sites and any of the three environment sensor input vectors to be overlaid onto the resultant display. (You may also optionally select 3Dimensional or Flat Limn display)
The image below illustrates how to display a combination of scientific input vectors for analysis:
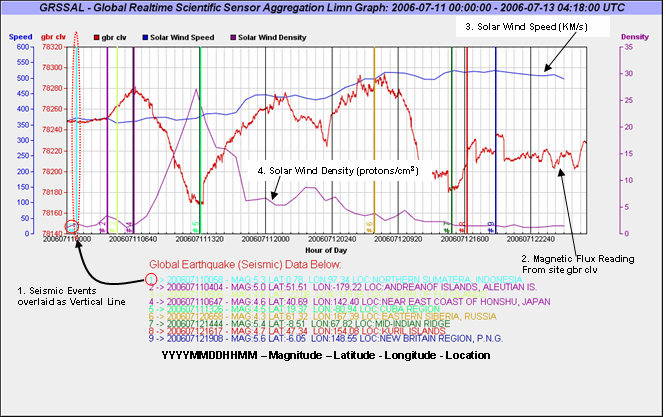
In this example the Seismic events (1) greater than a Magnitude of 5.0 are plotted as vertical bars overlaid on the limn. The associated Seismic event data is annotated below using a number to correlate the text to its associated event on the limn. Additionally, the example above illustrates magnetic flux readings from the sensor in England (2); Solar wind speed measured in Kilometers Per Second (3); Solar wind Density measured in protons per cubic centimeter(4).
You can visualize precise measurements by holding you mouse over one of the sensor lines, a browser popup should depict the precise reading for that sensor.
Troubleshooting Tip: If the GRSSAL produces a blank Limn the it is because the First Magnetic Sensor Site you selected was inoperative when the data query took place.
The GRSSAL will change often so please return to this page to note any changes to behavior or increases in capability.